Analysis of RNA kinetics
using
Alexey Uvarovskii, Christoph Dieterich
University Hospital Heidelberg
Analysis of RNA kinetics
using
Alexey Uvarovskii, Christoph Dieterich
University Hospital Heidelberg

Tobias Jakobi (Dieterich Lab) - computing support
David Vilchez, Seda
Koyuncu (CECAD Cologne),
Janine Altmüller, Marek Franitza (CCG Cologne) -
experimental data
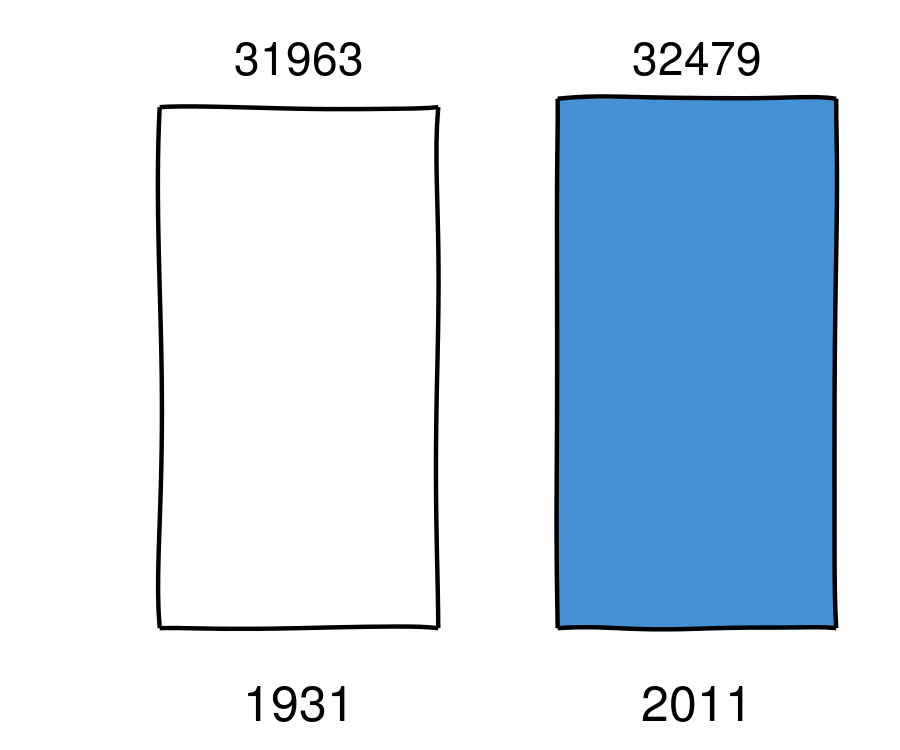
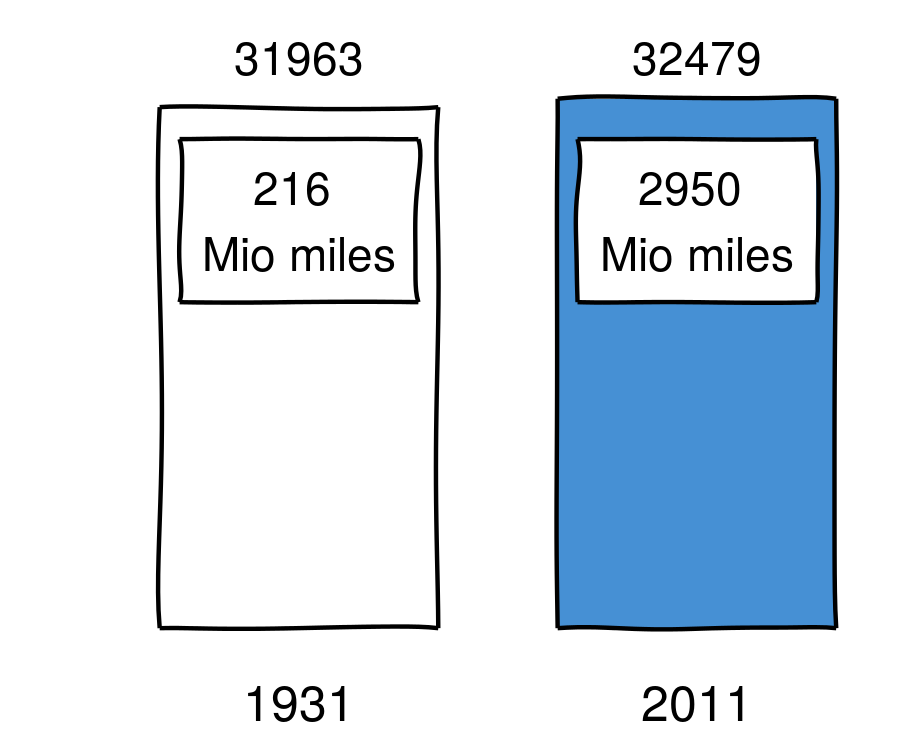
Number of motor vehicle deaths in the US (wiki)

$\sf \frac{d[\text{RNA}]}{dt} = +$ $\sf [\text{synthesis}] $ $\sf -$ $\sf [\text{degradation}]$ $\sf \cdot [\text{RNA}]$
$$ \sf [\text{steady state RNA}] = \frac{[\text{synthesis}]}{[\text{degradation }]}$$
EU = 5-ethyniluridine

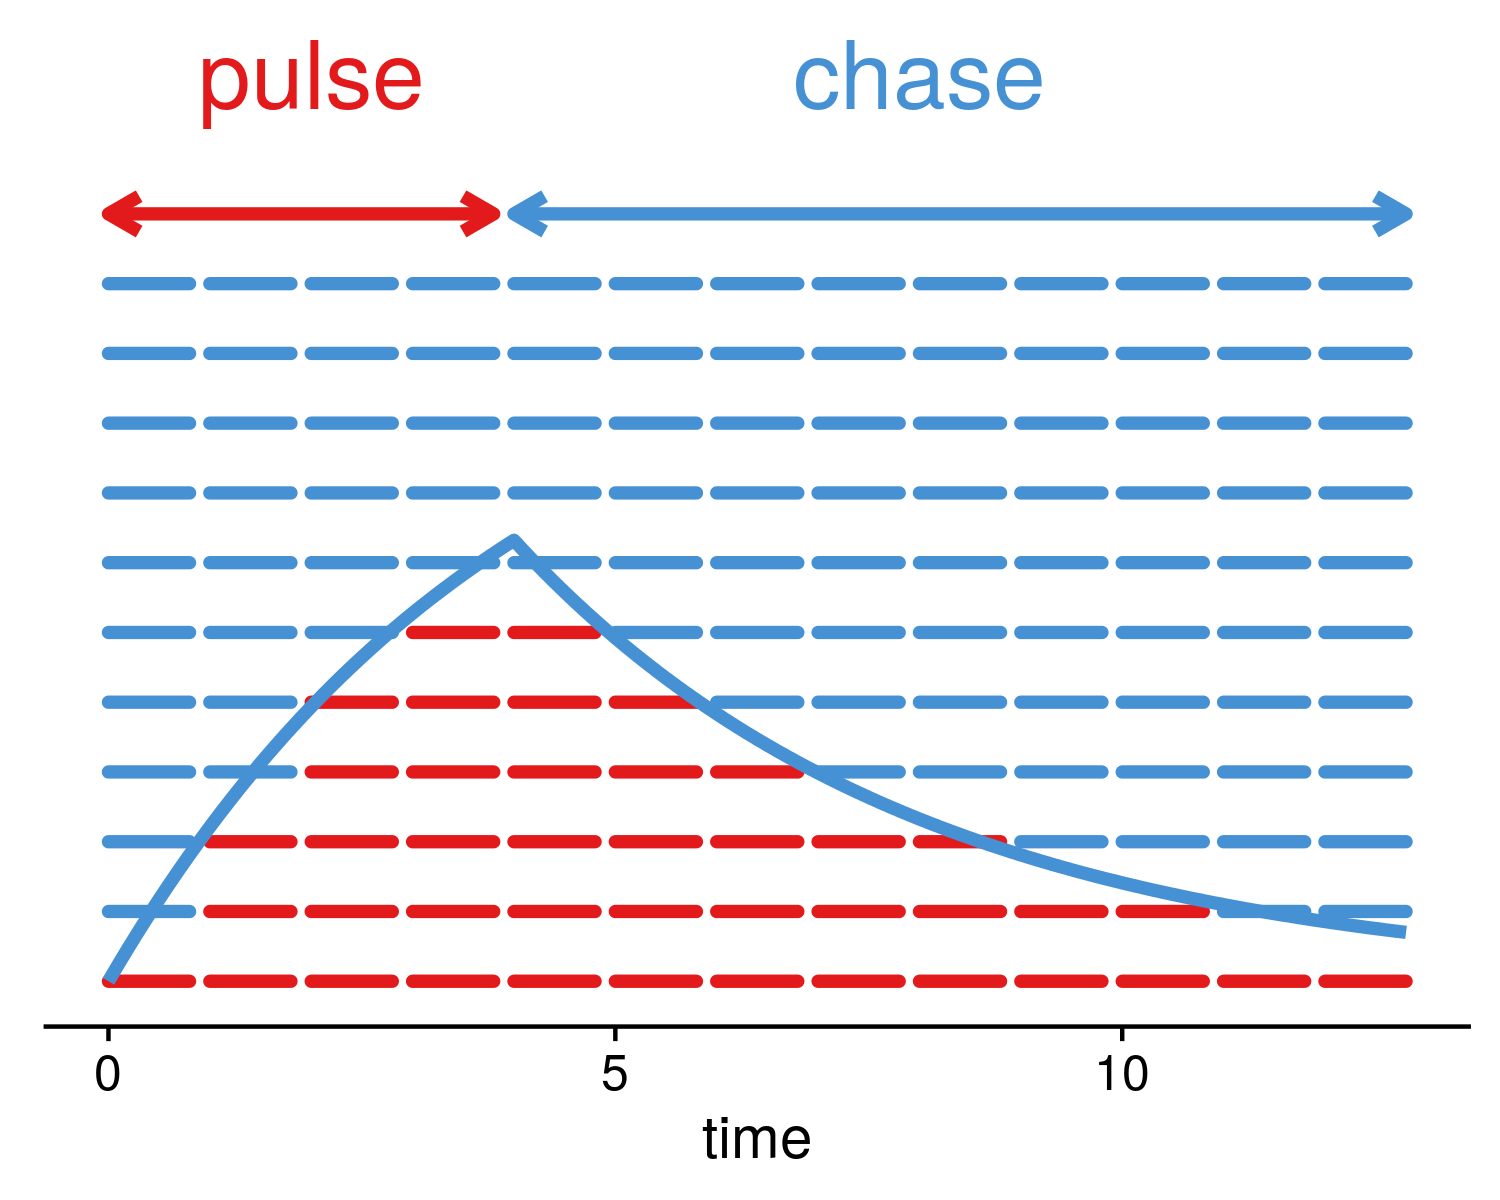
a way to measure RNA kinetics
Alexey Uvarovskii, Christoph Dieterich; pulseR: Versatile computational analysis of RNA turnover from metabolic labeling experiments. Bioinformatics 2017 btx368. doi: 10.1093/bioinformatics/btx368
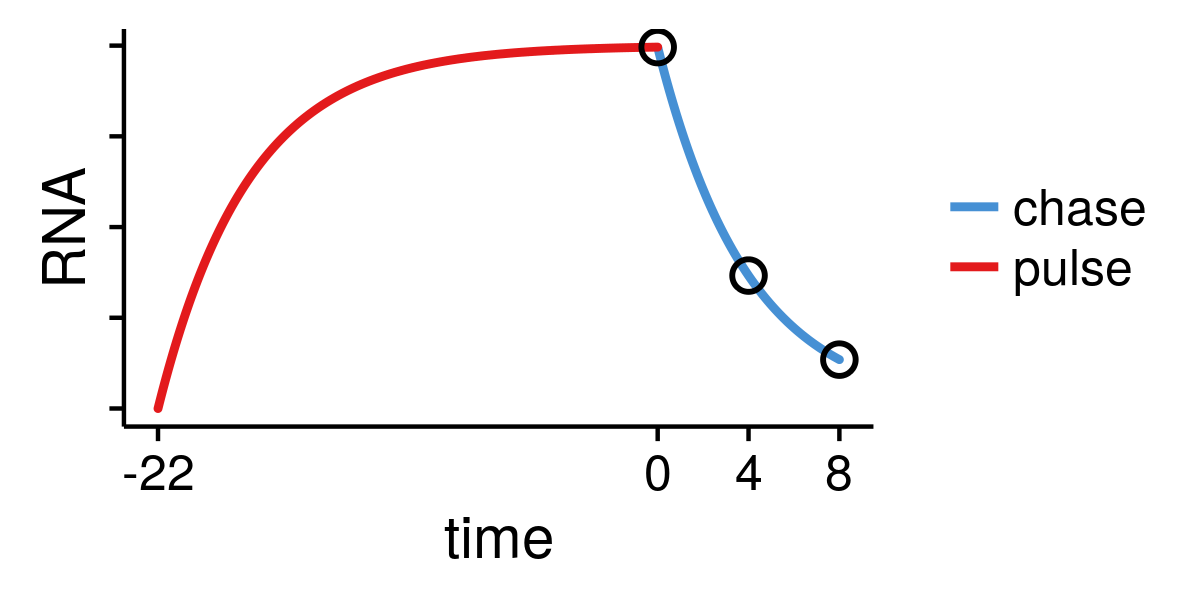
defined by the setup, e.g. pulse labelling is
$$ \begin{align} \sf [\text{total}] &= T\equiv\text{const} \\ \sf[\text{pull down}] &= T\cdot \left( 1 - e^{-dt}\right) \end{align}$$
$$\sf t = 1, 2, 4\, \text{hr} $$
Negative binomial distribution
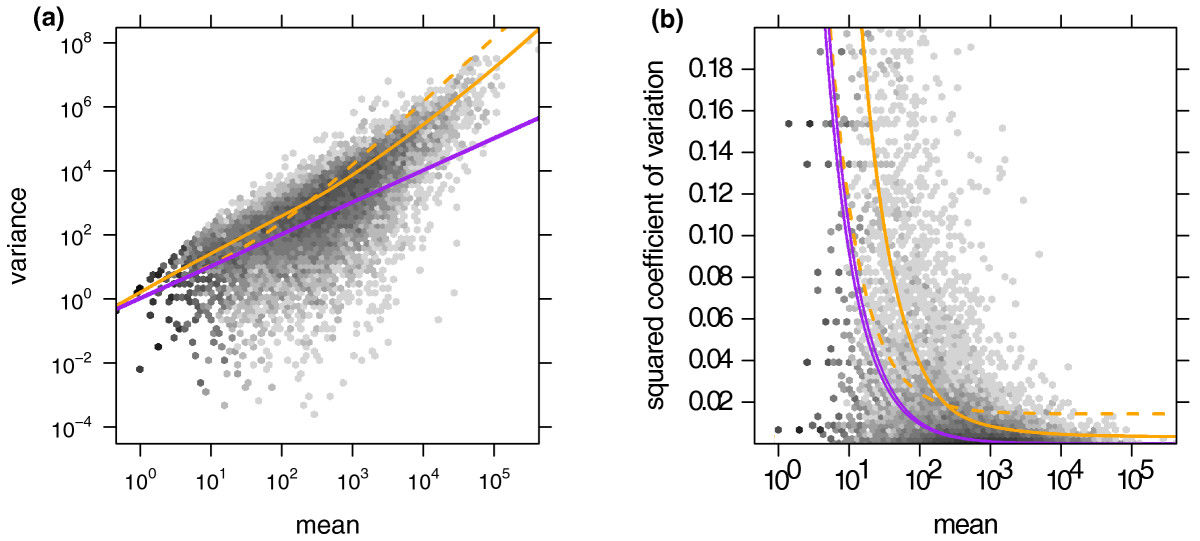
purple: no overdispersion, yellow: with overdispersion
Anders, Simon, and Wolfgang Huber. "Differential expression analysis for sequence count data." Genome biology 11.10 (2010): R106.
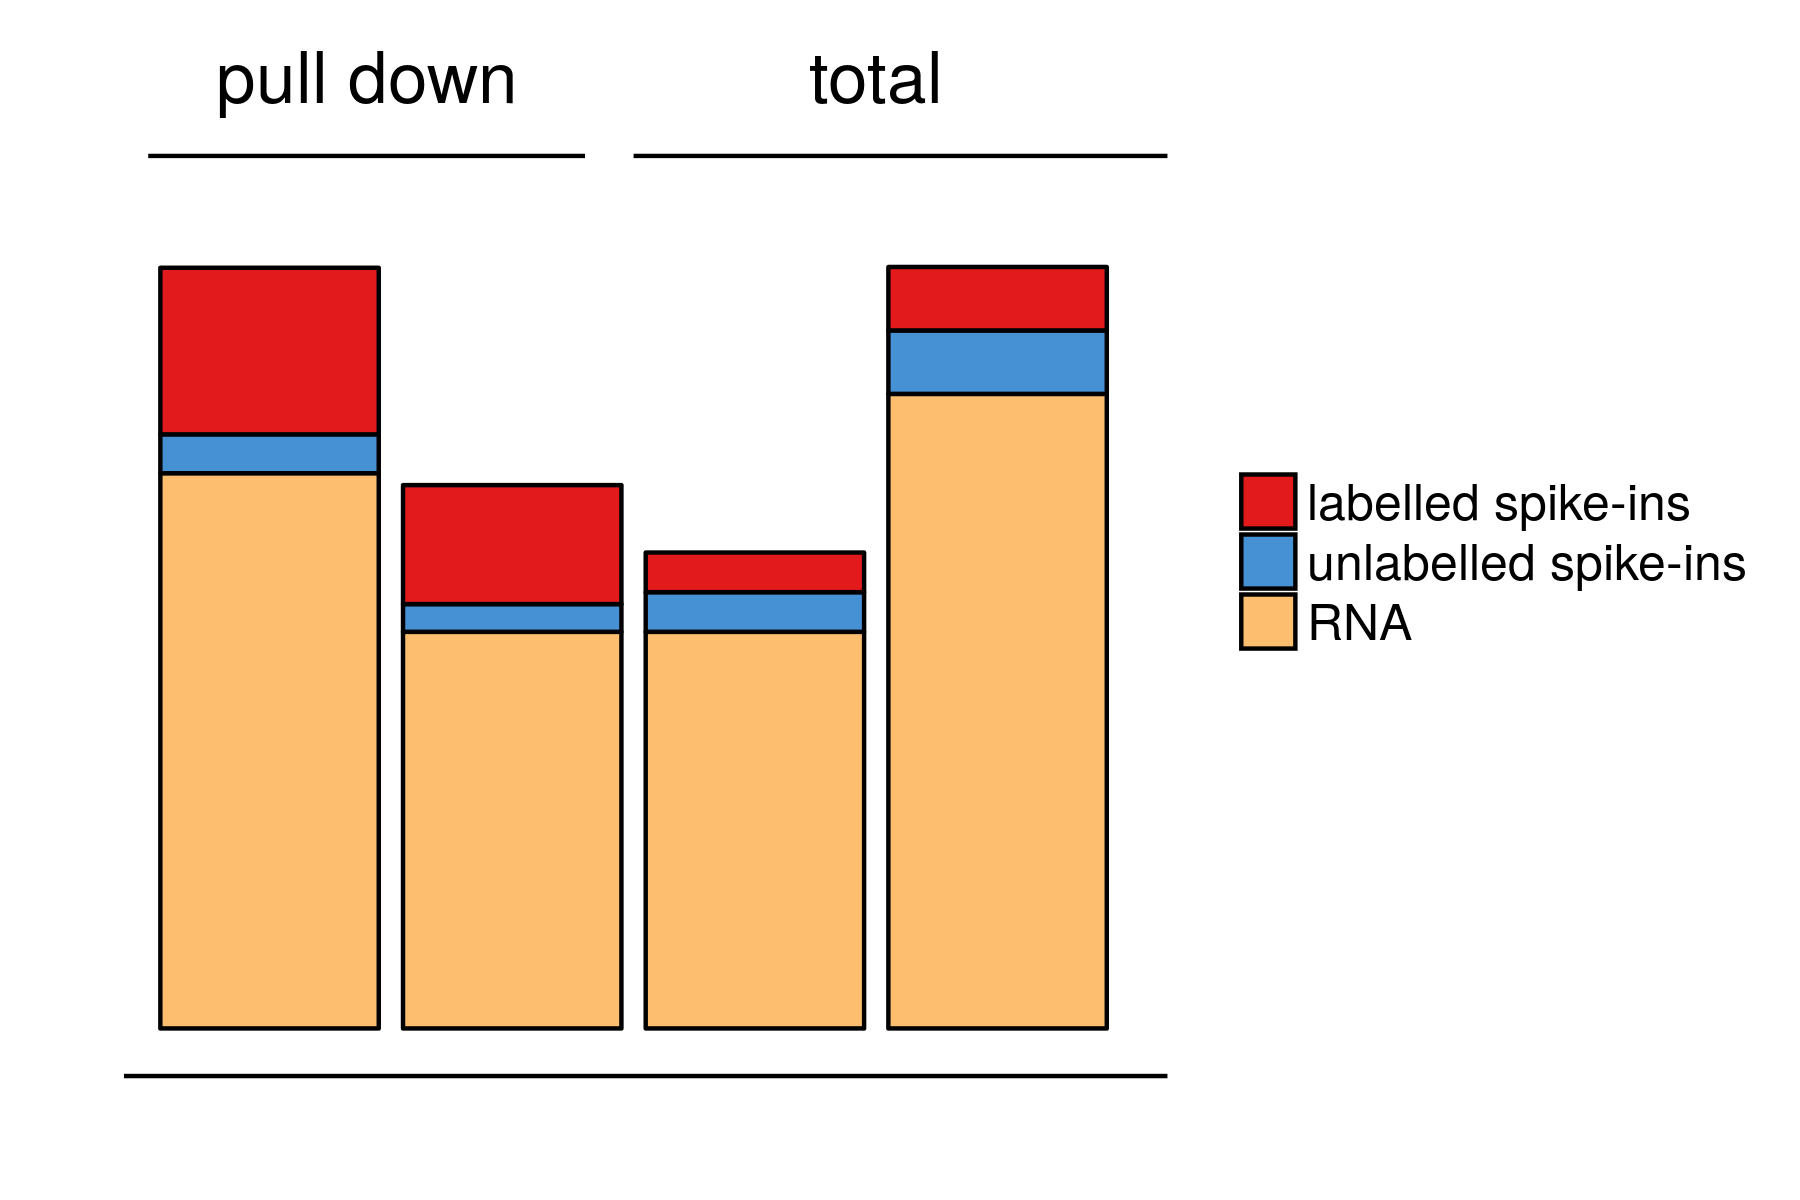
using spike-ins (DESeq)
by MLE fitting
absolute synthesis rate
no spike-ins needed
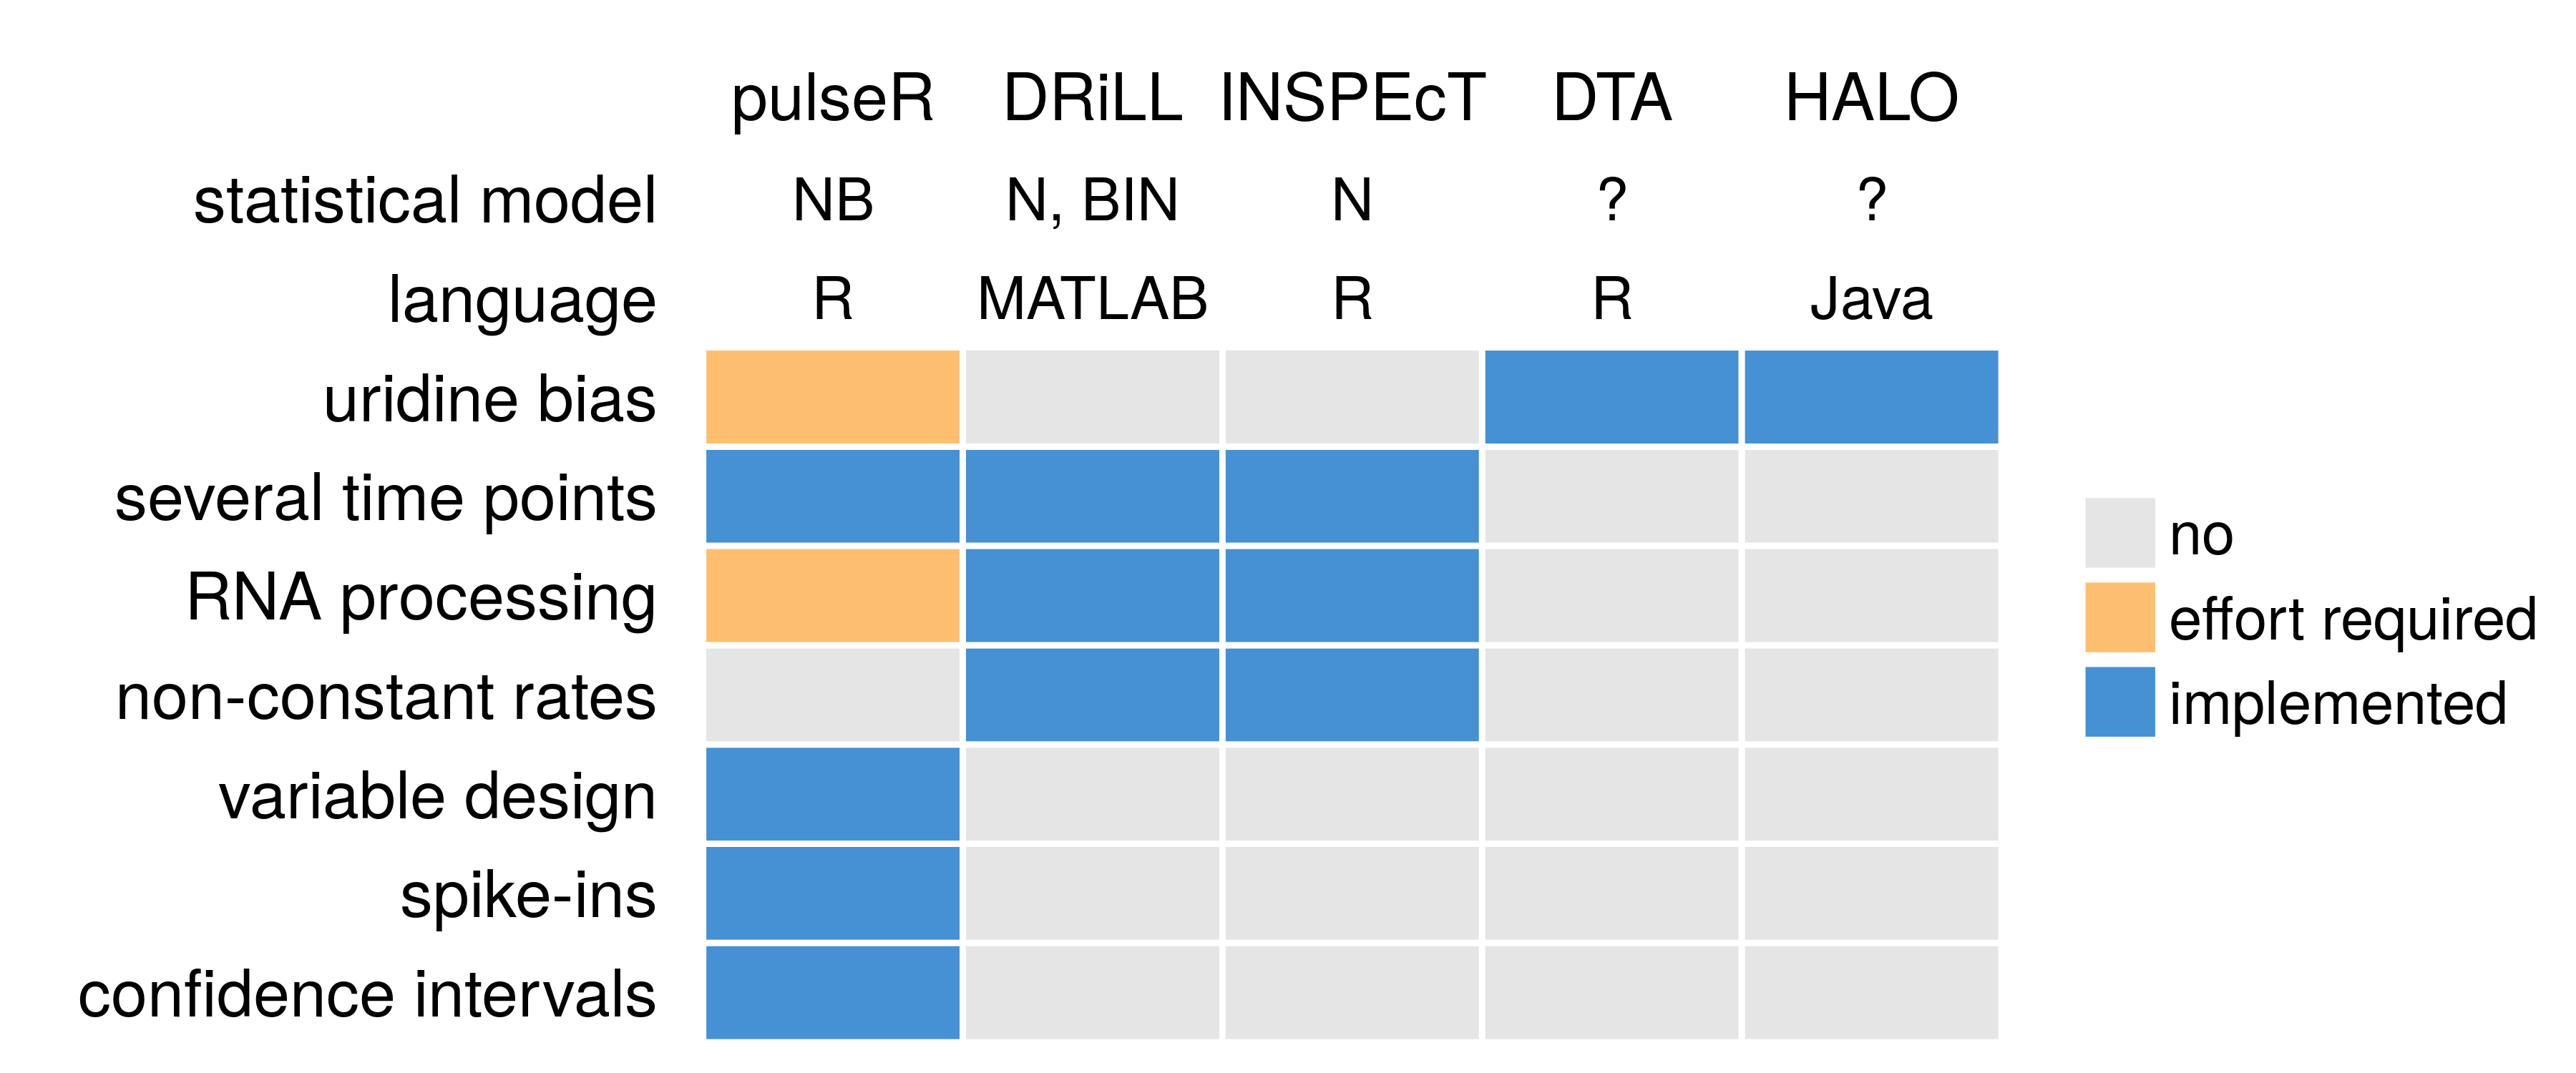
N: normal, NB: negative binomial, BIN: binomial.

design
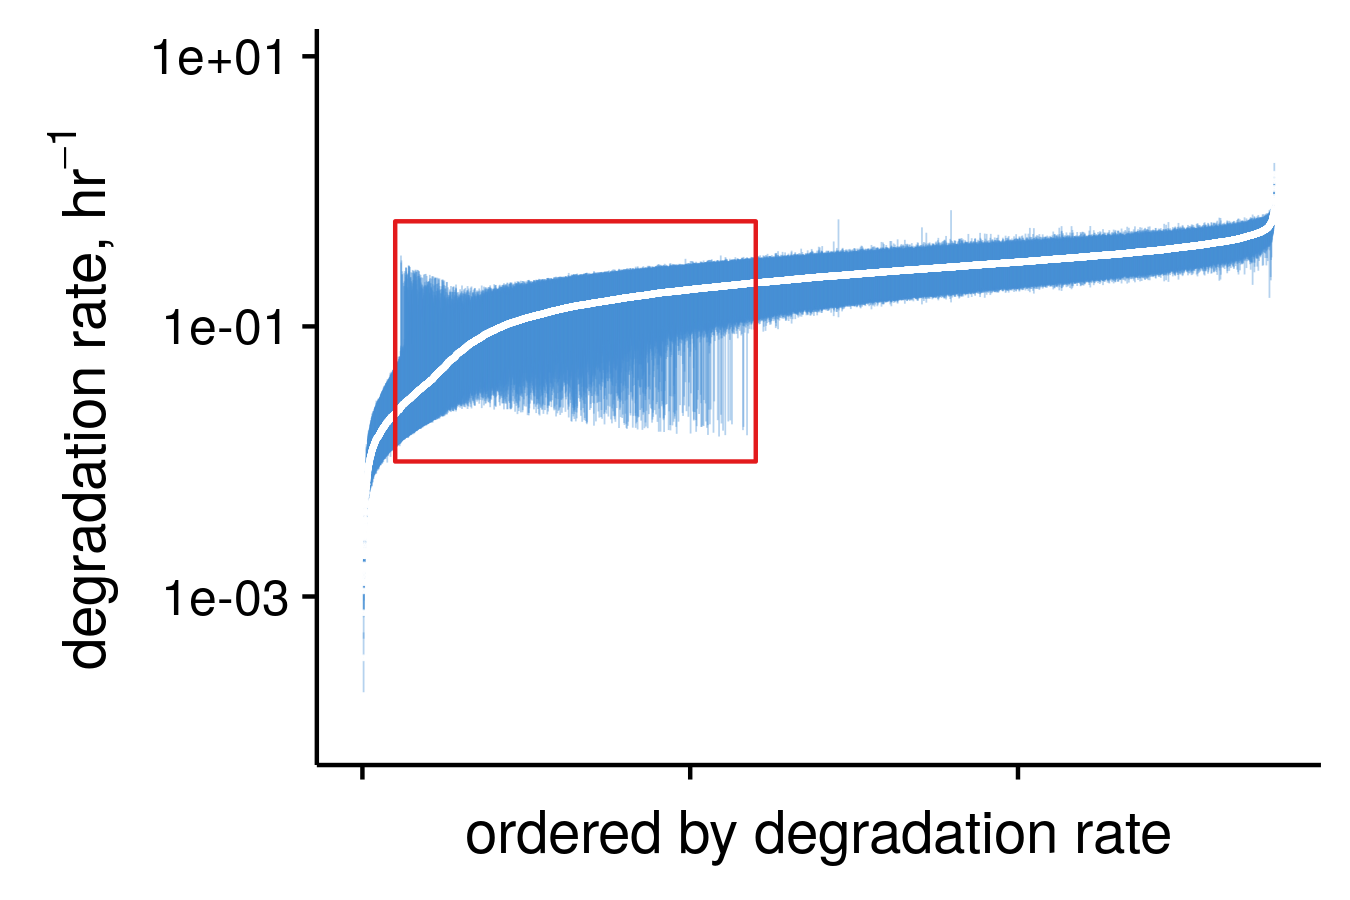
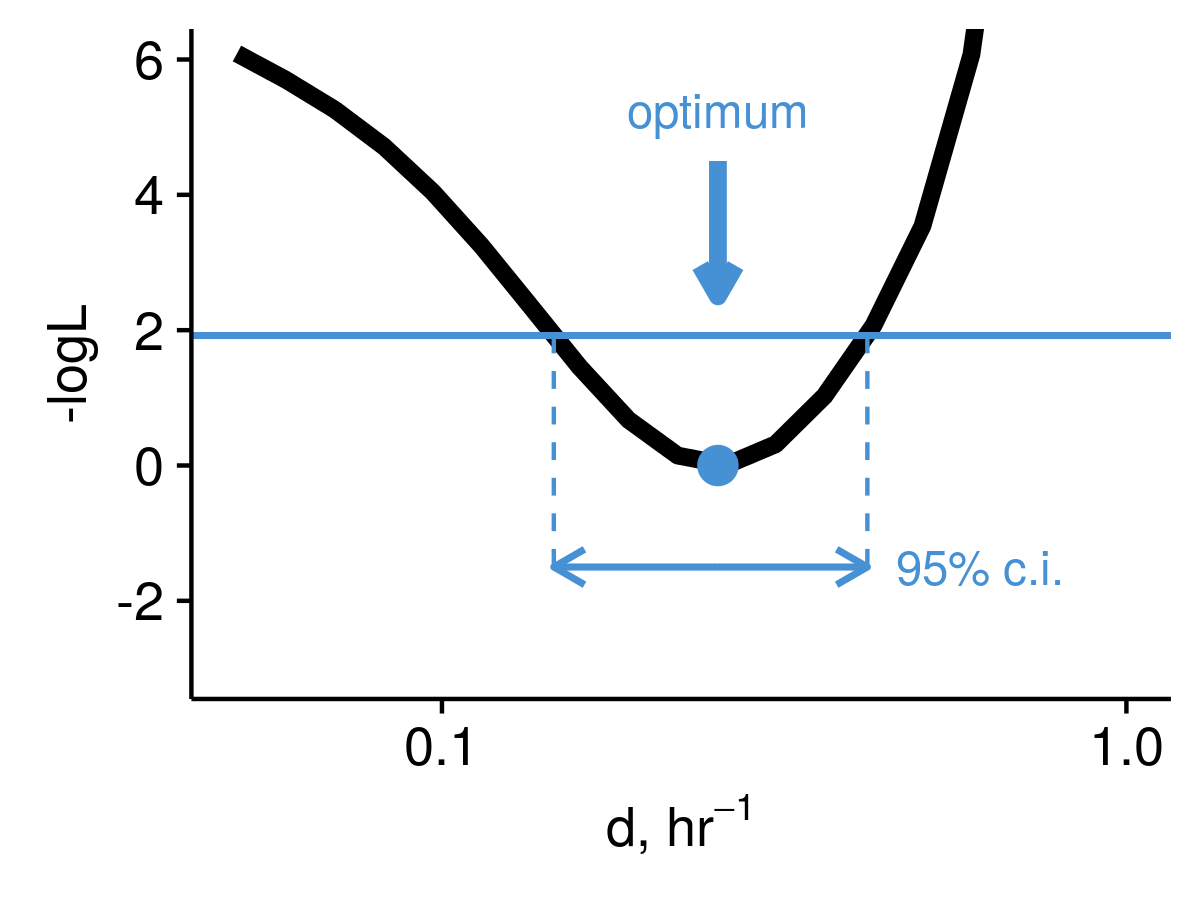
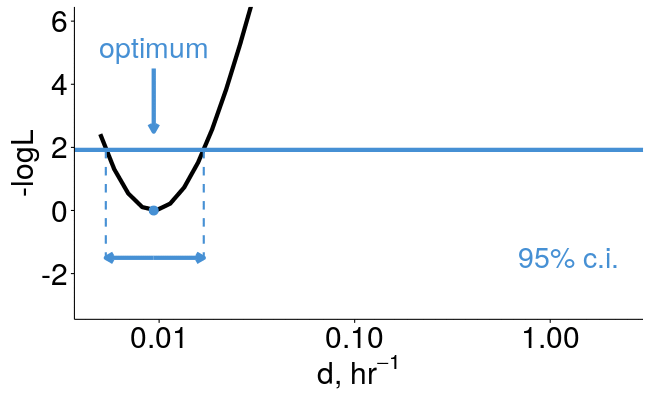
pulseR can estimate confidence intervals for you
diagnostics and comparisons

Poster A-271
An open post-doc position

a.uvarovskii@uni-heidelberg.de